Diagnostic Testing: Difference between revisions
No edit summary |
No edit summary |
||
| (19 intermediate revisions by 2 users not shown) | |||
| Line 1: | Line 1: | ||
==Electrocardiography (ECG)== | ==Electrocardiography (ECG)== | ||
[[Image:Nsr.png|400px|thumb|'''Figure 1.''' A short ECG registration of the normal heart rhythm (sinus rhythm). Source: | [[Image:Nsr.png|400px|thumb|'''Figure 1.''' A short ECG registration of the normal heart rhythm (sinus rhythm). Source: Ecgpedia.org]] | ||
The electrocardiogram asses the electrical activity of the human heart and translates this into a graphic representation. In ''Figure 1'' the body location for the 10 electrodes of a 12-channel ECG are shown. The exact placement of the electrodes is of utmost importance in obtaining an interpretable ECG. The ECG is a graphic representation of the difference in voltage between the patches over time. | The electrocardiogram asses the electrical activity of the human heart and translates this into a graphic representation. In ''Figure 1'' the body location for the 10 electrodes of a 12-channel ECG are shown. The exact placement of the electrodes is of utmost importance in obtaining an interpretable ECG. The ECG is a graphic representation of the difference in voltage between the patches over time. | ||
| Line 7: | Line 7: | ||
Several examples of the beneficial uses in diagnosis and treatment of cardiac patients are mentioned. However, keep in mind that the current list is only a brief summary and in real life the use of the ECG is broader. First, the ECG is an important tool in diagnosing and managing acute myocardial infarction. In patients with chest pain that is suspect for myocardial ischemia, the characteristic ST-segment changes (elevations or depressions) are one of the important corner stones of diagnosis and subsequent treatment. In addition, rapid resolution of the ECG changes of myocardial infarction after reperfusion therapy has prognostic value and identifies patients with reperfused coronary arteries. | Several examples of the beneficial uses in diagnosis and treatment of cardiac patients are mentioned. However, keep in mind that the current list is only a brief summary and in real life the use of the ECG is broader. First, the ECG is an important tool in diagnosing and managing acute myocardial infarction. In patients with chest pain that is suspect for myocardial ischemia, the characteristic ST-segment changes (elevations or depressions) are one of the important corner stones of diagnosis and subsequent treatment. In addition, rapid resolution of the ECG changes of myocardial infarction after reperfusion therapy has prognostic value and identifies patients with reperfused coronary arteries. | ||
In the diagnosis of the cause for severe rhythm disturbances, cardiac shock or after cardiac arrest the ECG is also of great importance for rapidly assessing possible underlying (cardiac) causes. Metabolic disturbances or medication induced arrhythmias can induce characteristic changes of the QT time, QRS and ST morphology. The diagnosis based on the ECG observations can be life-saving in emergency situations with patients in shock or after a cardiac arrest. | In the diagnosis of the cause for severe rhythm disturbances, cardiac shock or after cardiac arrest the ECG is also of great importance for rapidly assessing possible underlying (cardiac) causes. Metabolic disturbances or medication induced arrhythmias can induce characteristic changes of the QT time, QRS and ST morphology. The diagnosis based on the ECG observations can be life-saving in emergency situations with patients in shock or after a cardiac arrest. | ||
| Line 45: | Line 45: | ||
===Conduction=== | ===Conduction=== | ||
[[Image:QRSwaves.jpg|300px|thumb|'''Figure 2.''' A representation of the several intervals of an ECG. | [[Image:QRSwaves.jpg|300px|thumb|'''Figure 2.''' A representation of the several intervals of an ECG. Source: Ecgpedia.org]] | ||
Source: | |||
====PQ interval==== | ====PQ interval==== | ||
The PQ interval starts at the beginning of the atrial contraction and ends at the beginning of the ventricular contraction. | The PQ interval starts at the beginning of the atrial contraction and ends at the beginning of the ventricular contraction. | ||
| Line 83: | Line 83: | ||
The QT interval is prolonged in congenital long QT syndrome, but QT prolongation can also occur be acquired as results of: | The QT interval is prolonged in congenital long QT syndrome, but QT prolongation can also occur be acquired as results of: | ||
*Medication (anti-arrhythmics, tricyclic antidepressants, phenothiazedes, for a complete list see | *Medication (anti-arrhythmics, tricyclic antidepressants, phenothiazedes, for a complete list see [http://en.ecgpedia.org/wiki/Torsades Torsades]); | ||
*Electrolyte imbalances; | *Electrolyte imbalances; | ||
*Ischemia. | *Ischemia. | ||
| Line 143: | Line 143: | ||
Final conclusions should consist of one sentence, which sums up all important aspects of the ECG. It is not necessary to mention all 7 aspects, although one has to look at all of them to find the right conclusion! | Final conclusions should consist of one sentence, which sums up all important aspects of the ECG. It is not necessary to mention all 7 aspects, although one has to look at all of them to find the right conclusion! | ||
The normal characteristics of an ECG are shown below ( | The normal characteristics of an ECG are shown below (Table 1 and Figure 1). For more elaborate information on the ECG, please visit [http://en.ecgpedia.org Echopedia.org]. | ||
'''Characteristics of a normal ECG''' | '''Characteristics of a normal ECG''' | ||
| Line 168: | Line 168: | ||
==Echocardiography== | ==Echocardiography== | ||
Echocardiography is based on the use of ultrasound directed at the heart to create images of cardiac anatomy and display them in real time on a digital screen. The transthoracic echocardiography is obtained by placing a transducer in various positions on the anterior chest The processing of the ultrasound waves creates cross-sectional images of the heart and great vessels in a variety of standard planes. In general, echocardiography is a sensitive and non-invasive tool for detecting anatomic abnormalities of the heart and great vessels. | Echocardiography is based on the use of ultrasound directed at the heart to create images of cardiac anatomy and display them in real time on a digital screen. The transthoracic echocardiography is obtained by placing a transducer in various positions on the anterior chest The processing of the ultrasound waves creates cross-sectional images of the heart and great vessels in a variety of standard planes. In general, echocardiography is a sensitive and non-invasive tool for detecting anatomic abnormalities of the heart and great vessels. | ||
[[Image:Heart_lpla_echocardiography_diagram.jpg|300px|thumb|right|'''Figure 3.''' Transthoracic echocardiography. Heart normal LPLA left parasternal long axis echocardiography view.]] | |||
| | |||
| | |||
The two-dimensional echocardiographic imaging technique is used to investigate the heart in multiple planes in order to asses the existence of (dys)function and structural abnormalities of cardiac chambers and valves throughout the cardiac cycle. Both the cross sectional and longitudinal views are used to look for the presence of any anatomical or functional abnormalities with most of the structures of the heart. [''Figure 4 & 5''] | The two-dimensional echocardiographic imaging technique is used to investigate the heart in multiple planes in order to asses the existence of (dys)function and structural abnormalities of cardiac chambers and valves throughout the cardiac cycle. Both the cross sectional and longitudinal views are used to look for the presence of any anatomical or functional abnormalities with most of the structures of the heart. [''Figure 4 & 5''] | ||
[[Image:Apical_4_chamber_view.gif|300px|left|thumb|'''Figure 4.''' Apical four chamber view by two dimensional echocardiography. ]] | |||
[[Image:LeftVentricleShortAxis.gif|300px|right|thumb|'''Figure 5.''' Short axis view of left ventricle by two dimensional echocardiography. ]] | |||
| | |||
| | |||
In addition, in the cross sectional planes ventricular wall motion and left ventricular wall thickening during systole (an important measure of myocardial viability) can be investigated. The systematically assessment of cross sectional segment can also be used to estimate left ventricular volumes and ejection fraction. [''Figure 6''] | In addition, in the cross sectional planes ventricular wall motion and left ventricular wall thickening during systole (an important measure of myocardial viability) can be investigated. The systematically assessment of cross sectional segment can also be used to estimate left ventricular volumes and ejection fraction. [''Figure 6''] | ||
[[Image:Heart_short_axis_myocardial_segments.svg|300px|right|thumb|'''Figure 6.''' Heart short axis with myocardial segments. ]] | |||
| | |||
| | |||
Although the two-dimensional imaging technique gives superior view of the important structures of the heart, the analog echocardiographic display referred to as M-mode, motion-mode, or time-motion mode, is still in use for the high resolution axial and temporal imaging. The analog technique is preferred to measure the size of structures in its axial direction, and its high sampling rate allows for the resolution of complex cardiac motion patterns. [''Figure 7''] | Although the two-dimensional imaging technique gives superior view of the important structures of the heart, the analog echocardiographic display referred to as M-mode, motion-mode, or time-motion mode, is still in use for the high resolution axial and temporal imaging. The analog technique is preferred to measure the size of structures in its axial direction, and its high sampling rate allows for the resolution of complex cardiac motion patterns. [''Figure 7''] | ||
[[Image:PLAX_Mmode.jpg|300px|right|thumb|'''Figure 7.''' Echocardiogram in the parasternal long-axis view, showing a measurement of the heart's left ventricle in M-mode. ]] | |||
| | |||
| | |||
Doppler ultrasound is a technique of combined with the traditional ultrasound technique. The Doppler technique assesses changes in frequency of the reflected ultrasound compared with the transmitted ultrasound. The difference is used to be translated in a picture of the flow velocity. The continuous-wave Doppler mode is used to quantitate the exact velocity of the flow and estimate the pressure gradient when high velocities are suspected. The technique creates a graphic representation of the flow velocity in echotransducers’ beam in a time continuous wave. The technique is hampered by the fact that anatomical structures can make disturb the beam and subsequently the flow velocity measurement. When there is ambiguity about the source of the high velocity, pulsed-wave Doppler could be a more useful tool. This technique is range-gated in order to make it possible to investigate specific areas along the beam (sample volumes). Another technique widely integrated in echocardiography is the colour Doppler. The colour Doppler technique projects in coloured images informative for the direction of flow, the velocity, and the presence or absence of turbulent flow. The flow velocity colour images are in real-time combined with the two-dimensional structural imaging to investigate blood flow in the heart and great vessels. The colour Doppler image technique is in particular of use in detecting regurgitant blood flows across cardiac valves or to visualise any abnormal communications in the heart. [''Figure 8''] | Doppler ultrasound is a technique of combined with the traditional ultrasound technique. The Doppler technique assesses changes in frequency of the reflected ultrasound compared with the transmitted ultrasound. The difference is used to be translated in a picture of the flow velocity. The continuous-wave Doppler mode is used to quantitate the exact velocity of the flow and estimate the pressure gradient when high velocities are suspected. The technique creates a graphic representation of the flow velocity in echotransducers’ beam in a time continuous wave. The technique is hampered by the fact that anatomical structures can make disturb the beam and subsequently the flow velocity measurement. When there is ambiguity about the source of the high velocity, pulsed-wave Doppler could be a more useful tool. This technique is range-gated in order to make it possible to investigate specific areas along the beam (sample volumes). Another technique widely integrated in echocardiography is the colour Doppler. The colour Doppler technique projects in coloured images informative for the direction of flow, the velocity, and the presence or absence of turbulent flow. The flow velocity colour images are in real-time combined with the two-dimensional structural imaging to investigate blood flow in the heart and great vessels. The colour Doppler image technique is in particular of use in detecting regurgitant blood flows across cardiac valves or to visualise any abnormal communications in the heart. [''Figure 8''] | ||
[[Image:Ventricular_Septal_Defect.jpg|300px|right|thumb|'''Figure 8.''' Apical view with colour Doppler projection showing a ventricular septal defect. ]] | |||
| | |||
| | |||
The non-invasive echocardiography has now largely replaced cardiac catheterization for calculation of the hemodynamics changes caused by valvular disease. Several examples of methods to examine hemodynamics of the heart and valves by echocardiopgraphy are: | The non-invasive echocardiography has now largely replaced cardiac catheterization for calculation of the hemodynamics changes caused by valvular disease. Several examples of methods to examine hemodynamics of the heart and valves by echocardiopgraphy are: | ||
| Line 234: | Line 198: | ||
Unfortunately, it is impossible to obtain high-quality images or Doppler signals in as many a small percent of patients. Underlying conditions such as obesity, emphysema or chest wall deformities can limit the use of transthoracic echocardiography. A technique to partly cope with these limitations is transoesophageal echocardiography (TEE) [''Figure 9'']. | Unfortunately, it is impossible to obtain high-quality images or Doppler signals in as many a small percent of patients. Underlying conditions such as obesity, emphysema or chest wall deformities can limit the use of transthoracic echocardiography. A technique to partly cope with these limitations is transoesophageal echocardiography (TEE) [''Figure 9'']. | ||
[[Image:Transesophageal echocardiography diagram.svg|300px|thumb|'''Figure 9.''' Transoesophageal echocardiography ultrasound diagram.]] | |||
| | |||
With TEE a smaller ultrasound probe is placed on a gastroscopic device for introduction in the oesophagus behind the heart. Besides overcoming structural problems, in general TEE produces much higher resolution images of posterior cardiac structures. With TEE left atrial thrombi, small mitral valve vegetations, and thoracic aortic dissection can be diagnosed a high degree of accuracy. The downside of the techniques is the invasiveness of the procedure; the introduction of a probe into the oesophagus is very often experienced as rather uncomfortable by patients. | With TEE a smaller ultrasound probe is placed on a gastroscopic device for introduction in the oesophagus behind the heart. Besides overcoming structural problems, in general TEE produces much higher resolution images of posterior cardiac structures. With TEE left atrial thrombi, small mitral valve vegetations, and thoracic aortic dissection can be diagnosed a high degree of accuracy. The downside of the techniques is the invasiveness of the procedure; the introduction of a probe into the oesophagus is very often experienced as rather uncomfortable by patients. | ||
For more information on echocardiography, please visit | For more information on echocardiography, please visit [http://en.ecgpedia.org Echopedia.org]. | ||
==Cardiac stress test== | ==Cardiac stress test== | ||
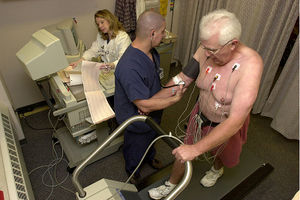
[[Image:Stress_test.jpg|thumb|300px|'''Figure 10.''' Cardiac stress test making use of a walking treadmill. Source: | [[Image:Stress_test.jpg|thumb|300px|thumb|'''Figure 10.''' Cardiac stress test making use of a walking treadmill. Source: Wikimedia public domain.]] | ||
Cardiac stress tests compare the coronary circulation while the patient is at rest with the same patient's circulation observed during maximum physical exertion, showing any abnormal blood flow to the heart's muscle tissue (the myocardium). This test can be used to diagnose ischemic heart disease, and for patient prognosis after a heart attack (myocardial infarction). | |||
The level of mechanical stress is progressively increased by adjusting the difficulty (steepness of the slope) and speed. The test administrator or attending physician examines the symptoms and blood pressure response. With use of ECG, the test is most commonly called a cardiac stress test, but is known by other names, such as exercise testing, stress testing treadmills, exercise tolerance test, stress test or stress test ECG. | |||
===Indication=== | |||
[[Image:StressECG STDepression.jpg|thumb|right|300px|Stress-ECG of a patient with coronary heart disease: ST-segment depression (arrow) at 100 watts of exercise. A: at rest, B: at 75 watts, C: at 100 watts, D: at 125 watts.]] | |||
The American Heart Association recommends ECG treadmill testing as the first choice for patients with medium risk of coronary heart disease according to risk factors of smoking, family history of coronary artery stenosis, hypertension, diabetes and high cholesterol. | |||
===Diagnostic value=== | |||
The common approach for stress testing by American College of Cardiology and American Heart Association indicates the following:<cite>Two</cite> | |||
*'''Treadmill test:''' sensitivity 73-90%, specificity 50-74% (Modified Bruce Protocol) | |||
*'''Nuclear test:''' sensitivity 81%, specificity 85-95% | |||
(Sensitivity is the percentage of sick people who are correctly identified as having the condition. Specificity indicates the percentage of healthy people who are correctly identified as not having the condition.) | |||
The value of stress tests has always been recognized as limited in assessing coronary atherosclerosis. This is because the stress test has a relatively high false-negative and false-positive rate. Other detection methods have higher sensitivity and specificity but this improved test characteristics often comes at a price, either in the form of radiation (CT), risk of complications in an invasive procedure (coronary angiography), or costs and limited availability (MRI). | |||
===Contraindications=== | |||
* | Stress cardiac imaging is not recommended for asymptomatic, low-risk patients as part of their routine care.<cite>Three</cite> Some estimates show that such screening accounts for 45% of cardiac stress imaging, and evidence does not show that this results in better outcomes for patients.<cite>Three</cite> Unless high-risk markers are present, such as diabetes in patients aged over 40, peripheral arterial disease; or a risk of coronary heart disease greater than 2 percent yearly, most health societies do not recommend the test as a routine procedure.<cite>Three</cite><cite>Four</cite><cite>Five</cite><cite>Six</cite> | ||
* | |||
* | Absolute contraindications to cardiac stress test include: | ||
* | |||
* | *Acute myocardial infarction within 48 hours | ||
*Unstable angina not yet stabilized with medical therapy | |||
The | *Uncontrolled cardiac arrhythmia, which may have significant hemodynamic responses (e.g. ventricular tachycardia) | ||
*Severe symptomatic aortic stenosis, aortic dissection, pulmonary embolism, and pericarditis | |||
*Multivessel coronary artery diseases that have a high risk of producing an acute myocardial infarction | |||
*Decompensated or inadequately controlled congestive heart failure<cite>Seven</cite> | |||
*Uncontrolled hypertension (blood pressure>200/110mm Hg)<cite>Seven</cite> | |||
*Severe pulmonary hypertension<cite>Seven</cite> | |||
*Acute aortic dissection<cite>Seven</cite> | |||
*Acutely ill for any reason<cite>Seven</cite> | |||
===Adverse effects=== | |||
Side effects from cardiac stress testing may include | |||
*Palpitations, chest pain, myocardial infarction, shortness of breath, headache, nausea or fatigue. | |||
*Adenosine and dipyridamole can cause mild hypotension. | |||
*As the tracers used for this test are carcinogenic, frequent use of these tests carries a small risk of cancer. | |||
===Limitations=== | |||
The stress test does not detect: | |||
*Atheroma | |||
*Vulnerable plaques | |||
The test has relatively high rates of false positives and false negatives compared with other clinical tests. | |||
===Results=== | |||
Once the stress test is completed, the patient generally is advised to not suddenly stop activity, but to slowly decrease the intensity of the exercise over the course of several minutes. | |||
*Increased spatial resolution allows a more sensitive detection of ischemia. | |||
*Stress testing, even if made in time, is not able to guarantee the prevention of symptoms, fainting, or death. Stress testing, although more effective than a resting ECG at detecting heart function, is only able to detect certain cardiac properties. | |||
*The detection of high-grade coronary artery stenosis by a cardiac stress test was the key to recognizing people who have heart attacks since 1980. From 1960 to 1990, despite the success of stress testing to identify many who were at high risk of heart attack, the inability of this test to correctly identify many others is discussed in medical circles but unexplained. | |||
*High degrees of coronary artery stenosis, which are detected by stress testing methods are often, though not always, responsible for recurrent symptoms of angina. | |||
*Unstable atheroma produces ''vulnerable plaques'' hidden within the walls of coronary arteries which go undetected by this test. | |||
*Limitation in blood flow to the left ventricle can lead to recurrent angina pectoris. | |||
==Stress echocardiography== | |||
A stress test may be accompanied by echocardiography.<cite>One</cite> The echocardiography is performed both before and after the exercise so that structural differences can be compared. | |||
==Nuclear stress test== | |||
The best known example is myocardial perfusion imaging. Typically, a radiotracer (Tc-99 sestamibi, Myoview or Thallous Chloride 201) may be injected during the test. After a suitable waiting period to ensure proper distribution of the radiotracer, photos are taken with a gamma camera to capture images of the blood flow. Photos taken before and after exercise are examined to assess the state of the coronary arteries of the patient. | |||
Showing the relative amounts of radioisotope within the heart muscle, the nuclear stress tests more accurately identify regional areas of reduced blood flow. | |||
Stress and potential cardiac damage from exercise during the test is a problem in patients with ECG abnormalities at rest or in patients with severe motor disability. Pharmacological stimulation from vasodilators such as dipyridamole or adenosine, or positive chronotropic agents such as dobutamine can be used. Testing personnel can include a cardiac radiologist, a nuclear medicine physician,a nuclear medicine technologist, a cardiology technologist, a cardiologist, and/or a nurse. | |||
==References== | |||
<biblio> | |||
#One Rimmerman, Curtis (2009-05-05). The Cleveland Clinic Guide to Heart Attacks. Kaplan Publishing. pp. 113–. ISBN 978-1-4277-9968-5. Retrieved 25 September 2011. | |||
#Two Gibbons, R., Balady, G.; Timothybricker, J., Chaitman, B., Fletcher, G., Froelicher, V., Mark, D., McCallister, B. et al. (2002). ACC / AHA 2002 guideline update for exercise testing: summary article ''A report of the American College of Cardiology / American Heart Association Task Force on Practice Guidelines'', Journal of the American College of Cardiology | |||
#Three American College of Cardiology, ''Five Things Physicians and Patients Should Question'', Choosing Wisely: an initiative of the ABIM Foundation (American College of Cardiology), retrieved August 17 2012 | |||
#Four Taylor, A. J.; Cerqueira, M.; Hodgson, J. M. .; Mark, D.; Min, J.; O'Gara, P.; Rubin, G. D.; American College of Cardiology Foundation Appropriate Use Criteria Task Force et al. (2010). ACCF/SCCT/ACR/AHA/ASE/ASNC/NASCI/SCAI/SCMR 2010 ''Appropriate Use Criteria for Cardiac Computed Tomography''. Journal of the American College of Cardiology 56 (22): 1864–1894. doi:10.1016/j.jacc.2010.07.005. PMID 21087721. edit | |||
#Five Douglas, P. S.; Garcia, M. J.; Haines, D. E.; Lai, W. W.; Manning, W. J.; Patel, A. R.; Picard, M. H.; Polk, D. M. et al. (2011). ACCF/ASE/AHA/ASNC/HFSA/HRS/SCAI/SCCM/SCCT/SCMR 2011 ''Appropriate Use Criteria for Echocardiography''. Journal of the American College of Cardiology 57 (9): 1126–1166. doi:10.1016/j.jacc.2010.11.002. PMID 21349406. edit | |||
#Six Hendel, R. C.; Abbott, B. G.; Bateman, T. M.; Blankstein, R.; Calnon, D. A.; Leppo, J. A.; Maddahi, J.; Schumaecker, M. M. et al. (2010). ''The role of radionuclide myocardial perfusion imaging for asymptomatic individuals''. Journal of Nuclear Cardiology 18 (1): 3–15. doi:10.1007/s12350-010-9320-5. PMID 21181519. edit | |||
#Seven Henzlova, Milena; Cerqueira, Hansen, Taillefer, Yao (2009). ''Stress Protocols and Tracers''. Journal of Nuclear Cardiology. doi:10.1007/s12350-009-9062-4. | |||
#Eight Weissman, Neil J.; Adelmann, Gabriel A. (2004). Cardiac imaging secrets. Elsevier Health Sciences. pp. 126–. ISBN 978-1-56053-515-7. Retrieved 25 September 2011. | |||
#Nine Nicholls, Stephen J.; Worthley, Stephen (2011-01). Cardiovascular Imaging for Clinical Practice. Jones & Bartlett Learning. pp. 198–. ISBN 978-0-7637-5622-2. Retrieved 25 September 2011. | |||
</biblio> | |||
Latest revision as of 20:24, 26 May 2015
Electrocardiography (ECG)
The electrocardiogram asses the electrical activity of the human heart and translates this into a graphic representation. In Figure 1 the body location for the 10 electrodes of a 12-channel ECG are shown. The exact placement of the electrodes is of utmost importance in obtaining an interpretable ECG. The ECG is a graphic representation of the difference in voltage between the patches over time.
An ECG can be used to directly clarify the mechanism of an irregular heart rhythm detected on physical examination or that of an extremely rapid or slow rhythm. In addition the ECG can help in identifying structural heart disease (i.e. cardiac hypertrophy), ischemic heart disease (i.e. myocardial infarction) or other causes of symptoms outside of the heart (i.e. pulmonary embolism). So called Holter monitoring or other continuous-ECG monitoring devices allow assessment of cardiac rate and rhythm on a continuous and ambulatory basis. The most common use of ECG monitoring is the evaluation of symptoms such as syncope, near-syncope, or palpitation for which there is no obvious cause and cardiac rhythm disturbances are suspected.
Several examples of the beneficial uses in diagnosis and treatment of cardiac patients are mentioned. However, keep in mind that the current list is only a brief summary and in real life the use of the ECG is broader. First, the ECG is an important tool in diagnosing and managing acute myocardial infarction. In patients with chest pain that is suspect for myocardial ischemia, the characteristic ST-segment changes (elevations or depressions) are one of the important corner stones of diagnosis and subsequent treatment. In addition, rapid resolution of the ECG changes of myocardial infarction after reperfusion therapy has prognostic value and identifies patients with reperfused coronary arteries.
In the diagnosis of the cause for severe rhythm disturbances, cardiac shock or after cardiac arrest the ECG is also of great importance for rapidly assessing possible underlying (cardiac) causes. Metabolic disturbances or medication induced arrhythmias can induce characteristic changes of the QT time, QRS and ST morphology. The diagnosis based on the ECG observations can be life-saving in emergency situations with patients in shock or after a cardiac arrest.
Another example of the helpful use of the ECG is the characteristic changes on the ECG associated with ventricular or atrial enlargement, which could strengthen the diagnosis of cardiomyopathic or valvular disease based on the physical examination.
Lastly, evidence of conduction abnormalities may help explain the mechanism of arrhythmias causing symptoms such as palpitations, syncope or angina
Structured ECG assessment
In order to be able to completely appreciate the information “hidden” in the simple graphic representation a structured assessment of the ECG at all time is of utmost importance. The 7+2 steps approach is a very well accepted method to fulfil this requirement:
- Rhythm
- Rate
- Conduction (PQ,QRS,QT)
- Heart Axis
- P Wave Morphology
- QRS Morphology
- ST Morphology
Interpretation:
- Compare with previous ECG
- Conclusion
Rhythm
The sinus node (SA) is located in the roof of the right atrium. It is the fastest physiological pacemaker. When the sinus node generates an electrical impulse, the surrounding cells of the right atrium depolarize. Then the cells of the left atrium, the AV (atrioventricular)node, follow, and at last the ventricles are stimulated via the His bundle. The presence and assessment of P-wave morphology is necessary to determine the rhythm. Normal sinus node rhythm can be presumed if the following criteria are met:
- P wave (atrial contraction) precedes every QRS complex;
- A P wave is followed by a QRS complex;
- The rhythm is regular, but varies slightly during respirations;
- The rate ranges between 60 and 100 beats per minute;
- The P waves maximum height at 2.5 mm in II and/or III;
- The P wave is positive in I and II, and biphasic in V1.
Rate
The heart rate represents the number of ventricular beats per minute. In normal conditions the heart rate is between 60 and 100 beats per minute.
The heart rate is determined by measuring the time between two QRS complexes. The ECG is normally printed on a paper strip transported through an ECG writer at the speed of 25 mm/second, or digitally represented at a similar taper speed. The ECG has a grid with thick lines 5 mm apart (= 0,20 second) and thin lines 1 mm (0,04 second). The easiest estimation method, easy to use in regular heart beats, to asses the rate is the “square counting method”.
Use the sequence 300-150-100-75-60-50-43-37. Count from the first QRS complex, the first thick line is 300, the next thick line 150 etc. Stop the sequence at the next QRS complex. When the second QRS complex is between two lines, take the mean of the two numbers from the sequence or use the fine-tuning method listed below.
Conduction
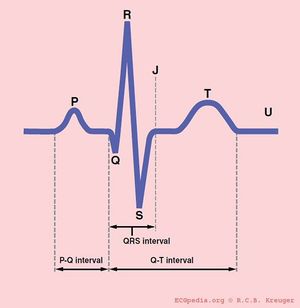
PQ interval
The PQ interval starts at the beginning of the atrial contraction and ends at the beginning of the ventricular contraction.
The PQ interval (sometimes referred to as the PR interval as a Q wave is not always present) indicates how fast the action potential is transmitted through the AV node (atrioventricular) from the atria to the ventricles. Measurement should start at the beginning of the P wave and end at the beginning of the QRS segment.
The normal PQ interval is between 0.12 and 0.20 seconds.
A prolonged PQ interval is a sign of a degradation of the conduction system or increased vagal tone (Bezold-Jarisch reflex), or it can be pharmacologically induced. This is called 1st, 2nd or 3rd degree AV block. A short PQ interval can be seen in the WPW syndrome in which faster-than-normal conduction exists between the atria and the ventricles.
QRS duration
The QRS duration indicates how fast the ventricles depolarize. The normal QRS is < 0.10 seconds.
The ventricles depolarize normally within 0.10 seconds. When this is longer than 110 milliseconds, this is a conduction delay. Possible causes of a QRS duration > 110 milliseconds include:
- Left bundle branch block;
- Right bundle branch block;
- Electrolyte Disorders;
- Atrioventricular rhythm and paced rhythm.
For the diagnosis of LBBB or RBBB QRS duration must be >120 ms.
QR interval
The normal QTc (corrected) interval The QT interval indicates how fast the ventricles are repolarised, becoming ready for a new cycle.
The normal value for QTc is: below 450ms for men and below 460ms for women. If QTc is < 340ms short QT syndrome can be considered.
The QT interval comprises the QRS-complex, the ST-segment, and the T-wave. One difficultly of QT interpretation is that the QT interval gets shorter as the heart rate increases. This problem can be solved by correcting the QT time for heart rate using the Bazett formula:
Thus at a heart rate of 60 beats per minute, the RR interval is 1 second and the QTc equals QT/1. The QTc calculator can be used to easily calculate QTc from the QT and the heart rate or RR interval.
On modern ECG machines, the QTc is given. However, the machines are not always capable of making the correct determination of the end of the T wave. Therefore, it is important to check the QT time manually Conduction. Most QT experts define the end of the T wave as the intersection of the steepest tangent line from the end of the T-wave with the base line of the ECG.
In a pathological prolonged QT time, it takes longer than the normal amount of time for the myocardial cells to be ready for a new cycle. There is a possibility that some cells are not yet repolarised, but that a new cycle is already initiated. These cells are at risk for uncontrolled depolarization, induction of Torsade de Pointes and subsequent Ventricular Fibrillation.
The QT interval is prolonged in congenital long QT syndrome, but QT prolongation can also occur be acquired as results of:
- Medication (anti-arrhythmics, tricyclic antidepressants, phenothiazedes, for a complete list see Torsades);
- Electrolyte imbalances;
- Ischemia.
Heart axis
The electrical heart axis is an average of all depolarisations in the heart. The depolarization wave begins in the right atrium and proceeds to the left and right ventricle. Because the left ventricle wall is thicker than the right wall, the arrow indicating the direction of the depolarization wave is directed to the left.
One can easily estimate the heart axis by looking at leads I and AVF:
- Positive (the average of the QRS surface above the baseline) QRS deflection in lead I: the electrical activity is directed to the left (of the patient);
- Positive QRS deflection in lead AVF: the electrical activity is directed down.
This indicates a normal heart axis. Usually, these two leads are enough to diagnose a normal heart axis! A normal heart axis is between -30 and +90 degrees.
Abnormal axis can be:
- A left heart axis is present when the QRS in lead I is positive and negative in II and AVF. (between -30 and -90 degrees);
- A right heart axis is present when lead I is negative and AVF positive. (between +90 and -180 degrees);
- An extreme heart axis is present when both I and AVF are negative. This is a rare finding. (between -90 and -180 degrees).
P wave morphology
The P-wave morphology can reveal right or left atrial hypertrophy or atrial arrhythmias and is best determined in leads II and V1 during sinus rhythm.
Characteristics of a normal P-wave:
- The maximal height of the P wave is 2.5 mm in leads II and / or III;
- The p wave is positive in II and AVF, and biphasic in V1;
- The p wave duration is shorter than 0.12 seconds.
Abnormal P-wave morphology could be:
- A elevation or depression of the PTa segment (the part between the p wave and the beginning of the QRS complex), resulting from atrial infarction or pericarditis;
- P-wave enlargement due to atrial enlargement;
- If the P-wave inversion most likely caused by an ectopic atrial rhythm not originating from the sinus node.
QRS morphology
The basic questions in judging QRS morphology are:
- Are there any pathological Q waves as a sign of previous myocardial infarction?
- Are there signs of left or right ventricular hypertrophy?
- Does the QRS complex show microvoltage (roughly QRS < 5mm)?
- Is the conduction normal or prolonged (QRS-interval > 0,12s)?
- Is the R wave propagation normal? Normally R waves become larger from V1-V5. At V5 it should be maximal. If the R wave in V2 is larger than in V3, this could be a sign of a (previous) posterior myocardial infarction.
- If all these items are normal you can go on to the next step: ST morphology.
ST morphology
The ST segment represents ventricular repolarisation. Repolarisation follows upon contraction and depolarization. During repolarisation the cardiomyocytes elongate and prepare for the next heartbeat. This process takes much more time than the depolarization. The elongation that takes place during repolarisation is not passive; it is an active process during which energy is consumed. On the ECG, the repolarisation phase starts at the junction, or j point, and continues until the T wave. The ST segment is normally at or near the baseline. Minor STT changes are not necessarily associated with cardiac ischemia.
The T wave is usually concordant with the QRS complex. Thus if the QRS complex is positive in a certain lead (the area under the curve above the baseline is greater than the area under the curve below the baseline) than the T wave usually is positive too in that lead. Accordingly the T wave is normally upright or positive in leads I, II, AVL, AVF and V3-V6. The T wave is negative in V1 and AVR. The T wave flips around V2, but there is likely some genetic influence in this as in Blacks the T wave usually flips around V3.
The T wave angle is the result of small differences in the duration of the repolarisation between the endocardial and epicardial layers of the left ventricle. The endocardial myocytes need a little more time to repolarise (about 22 msec). This difference causes an electrical current from the endocardium to the epicardium, which reads as a positive signal on the ECG.
ST segment abnormalities include the following:
- ST segment elevation
- ST segment depression
- Flat T wave
- Negative (or inverted) T wave
A broad spectrum of disease could cause ST segment abnormalities such as (acute) ischemia (ST segment elevation and/or depression and T wave inversion), pulmonary embolism (ST segment elevation), acute neurologic events (ST segment elevation), and pericarditis (ST segment elevation). For a complete list see ST Morphology
Compare the old and the new ECG An abnormal ECG does not directly and solely prove acute cardiac disease. And a normal ECG does not exclude cardiac disease. It is necessary therefore to compare new ECG with ECGs made in the past on all 7 aspects mentioned above.
Interpretation of the ECG Final conclusions should consist of one sentence, which sums up all important aspects of the ECG. It is not necessary to mention all 7 aspects, although one has to look at all of them to find the right conclusion!
The normal characteristics of an ECG are shown below (Table 1 and Figure 1). For more elaborate information on the ECG, please visit Echopedia.org.
Characteristics of a normal ECG
- Rhythm: sinus
- Rate: 60-100 bpm
- Conduction:
- PQ interval 120-200ms
- QRS width 60-100ms
- QTc interval 390-450ms (use the QTc calculator for this)
- Heart axis: between -30 and +90 degrees
- P wave morphology:
- The maximal height of the P wave is 2.5 mm in leads II and / or III
- The p wave is positive in II and AVF, and biphasic in V1
- The p wave duration is usually shorter than 0.12 seconds
- QRS morphology:
- No pathological Q waves
- No left or right ventricular hypertrophy
- No microvoltage
- Normal R wave propagation. (R waves increase in amplitude from V1-V5)
- ST morphology:
- No ST elevation or depression
- T waves should be concordant with the QRS complex
- The ECG should not have changed from the previous ECG
Echocardiography
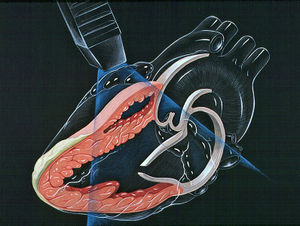
Echocardiography is based on the use of ultrasound directed at the heart to create images of cardiac anatomy and display them in real time on a digital screen. The transthoracic echocardiography is obtained by placing a transducer in various positions on the anterior chest The processing of the ultrasound waves creates cross-sectional images of the heart and great vessels in a variety of standard planes. In general, echocardiography is a sensitive and non-invasive tool for detecting anatomic abnormalities of the heart and great vessels.
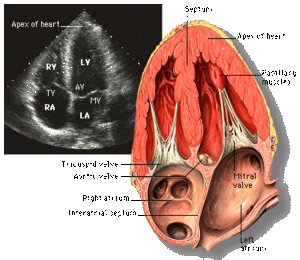
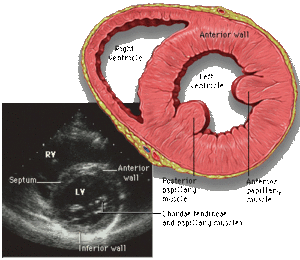
The two-dimensional echocardiographic imaging technique is used to investigate the heart in multiple planes in order to asses the existence of (dys)function and structural abnormalities of cardiac chambers and valves throughout the cardiac cycle. Both the cross sectional and longitudinal views are used to look for the presence of any anatomical or functional abnormalities with most of the structures of the heart. [Figure 4 & 5]
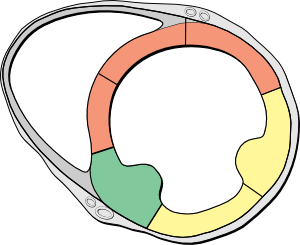
In addition, in the cross sectional planes ventricular wall motion and left ventricular wall thickening during systole (an important measure of myocardial viability) can be investigated. The systematically assessment of cross sectional segment can also be used to estimate left ventricular volumes and ejection fraction. [Figure 6]
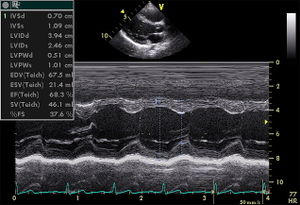
Although the two-dimensional imaging technique gives superior view of the important structures of the heart, the analog echocardiographic display referred to as M-mode, motion-mode, or time-motion mode, is still in use for the high resolution axial and temporal imaging. The analog technique is preferred to measure the size of structures in its axial direction, and its high sampling rate allows for the resolution of complex cardiac motion patterns. [Figure 7]
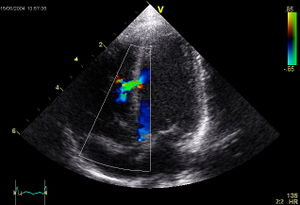
Doppler ultrasound is a technique of combined with the traditional ultrasound technique. The Doppler technique assesses changes in frequency of the reflected ultrasound compared with the transmitted ultrasound. The difference is used to be translated in a picture of the flow velocity. The continuous-wave Doppler mode is used to quantitate the exact velocity of the flow and estimate the pressure gradient when high velocities are suspected. The technique creates a graphic representation of the flow velocity in echotransducers’ beam in a time continuous wave. The technique is hampered by the fact that anatomical structures can make disturb the beam and subsequently the flow velocity measurement. When there is ambiguity about the source of the high velocity, pulsed-wave Doppler could be a more useful tool. This technique is range-gated in order to make it possible to investigate specific areas along the beam (sample volumes). Another technique widely integrated in echocardiography is the colour Doppler. The colour Doppler technique projects in coloured images informative for the direction of flow, the velocity, and the presence or absence of turbulent flow. The flow velocity colour images are in real-time combined with the two-dimensional structural imaging to investigate blood flow in the heart and great vessels. The colour Doppler image technique is in particular of use in detecting regurgitant blood flows across cardiac valves or to visualise any abnormal communications in the heart. [Figure 8]
The non-invasive echocardiography has now largely replaced cardiac catheterization for calculation of the hemodynamics changes caused by valvular disease. Several examples of methods to examine hemodynamics of the heart and valves by echocardiopgraphy are:
- Velocities across a valve can be converted to pressure gradients;
- Velocities at cardiac anatomic sites of known size on the two-dimensional echocardiographic can be converted to cardiac output;
- Cardiac output and pressure gradients can be used to calculate the stenotic valve area.
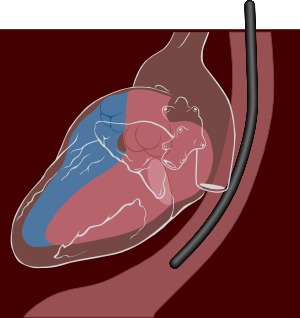
Unfortunately, it is impossible to obtain high-quality images or Doppler signals in as many a small percent of patients. Underlying conditions such as obesity, emphysema or chest wall deformities can limit the use of transthoracic echocardiography. A technique to partly cope with these limitations is transoesophageal echocardiography (TEE) [Figure 9].
With TEE a smaller ultrasound probe is placed on a gastroscopic device for introduction in the oesophagus behind the heart. Besides overcoming structural problems, in general TEE produces much higher resolution images of posterior cardiac structures. With TEE left atrial thrombi, small mitral valve vegetations, and thoracic aortic dissection can be diagnosed a high degree of accuracy. The downside of the techniques is the invasiveness of the procedure; the introduction of a probe into the oesophagus is very often experienced as rather uncomfortable by patients.
For more information on echocardiography, please visit Echopedia.org.
Cardiac stress test
Cardiac stress tests compare the coronary circulation while the patient is at rest with the same patient's circulation observed during maximum physical exertion, showing any abnormal blood flow to the heart's muscle tissue (the myocardium). This test can be used to diagnose ischemic heart disease, and for patient prognosis after a heart attack (myocardial infarction).
The level of mechanical stress is progressively increased by adjusting the difficulty (steepness of the slope) and speed. The test administrator or attending physician examines the symptoms and blood pressure response. With use of ECG, the test is most commonly called a cardiac stress test, but is known by other names, such as exercise testing, stress testing treadmills, exercise tolerance test, stress test or stress test ECG.
Indication
The American Heart Association recommends ECG treadmill testing as the first choice for patients with medium risk of coronary heart disease according to risk factors of smoking, family history of coronary artery stenosis, hypertension, diabetes and high cholesterol.
Diagnostic value
The common approach for stress testing by American College of Cardiology and American Heart Association indicates the following:[1]
- Treadmill test: sensitivity 73-90%, specificity 50-74% (Modified Bruce Protocol)
- Nuclear test: sensitivity 81%, specificity 85-95%
(Sensitivity is the percentage of sick people who are correctly identified as having the condition. Specificity indicates the percentage of healthy people who are correctly identified as not having the condition.)
The value of stress tests has always been recognized as limited in assessing coronary atherosclerosis. This is because the stress test has a relatively high false-negative and false-positive rate. Other detection methods have higher sensitivity and specificity but this improved test characteristics often comes at a price, either in the form of radiation (CT), risk of complications in an invasive procedure (coronary angiography), or costs and limited availability (MRI).
Contraindications
Stress cardiac imaging is not recommended for asymptomatic, low-risk patients as part of their routine care.[2] Some estimates show that such screening accounts for 45% of cardiac stress imaging, and evidence does not show that this results in better outcomes for patients.[2] Unless high-risk markers are present, such as diabetes in patients aged over 40, peripheral arterial disease; or a risk of coronary heart disease greater than 2 percent yearly, most health societies do not recommend the test as a routine procedure.[2][3][4][5]
Absolute contraindications to cardiac stress test include:
- Acute myocardial infarction within 48 hours
- Unstable angina not yet stabilized with medical therapy
- Uncontrolled cardiac arrhythmia, which may have significant hemodynamic responses (e.g. ventricular tachycardia)
- Severe symptomatic aortic stenosis, aortic dissection, pulmonary embolism, and pericarditis
- Multivessel coronary artery diseases that have a high risk of producing an acute myocardial infarction
- Decompensated or inadequately controlled congestive heart failure[6]
- Uncontrolled hypertension (blood pressure>200/110mm Hg)[6]
- Severe pulmonary hypertension[6]
- Acute aortic dissection[6]
- Acutely ill for any reason[6]
Adverse effects
Side effects from cardiac stress testing may include
- Palpitations, chest pain, myocardial infarction, shortness of breath, headache, nausea or fatigue.
- Adenosine and dipyridamole can cause mild hypotension.
- As the tracers used for this test are carcinogenic, frequent use of these tests carries a small risk of cancer.
Limitations
The stress test does not detect:
- Atheroma
- Vulnerable plaques
The test has relatively high rates of false positives and false negatives compared with other clinical tests.
Results
Once the stress test is completed, the patient generally is advised to not suddenly stop activity, but to slowly decrease the intensity of the exercise over the course of several minutes.
- Increased spatial resolution allows a more sensitive detection of ischemia.
- Stress testing, even if made in time, is not able to guarantee the prevention of symptoms, fainting, or death. Stress testing, although more effective than a resting ECG at detecting heart function, is only able to detect certain cardiac properties.
- The detection of high-grade coronary artery stenosis by a cardiac stress test was the key to recognizing people who have heart attacks since 1980. From 1960 to 1990, despite the success of stress testing to identify many who were at high risk of heart attack, the inability of this test to correctly identify many others is discussed in medical circles but unexplained.
- High degrees of coronary artery stenosis, which are detected by stress testing methods are often, though not always, responsible for recurrent symptoms of angina.
- Unstable atheroma produces vulnerable plaques hidden within the walls of coronary arteries which go undetected by this test.
- Limitation in blood flow to the left ventricle can lead to recurrent angina pectoris.
Stress echocardiography
A stress test may be accompanied by echocardiography.[7] The echocardiography is performed both before and after the exercise so that structural differences can be compared.
Nuclear stress test
The best known example is myocardial perfusion imaging. Typically, a radiotracer (Tc-99 sestamibi, Myoview or Thallous Chloride 201) may be injected during the test. After a suitable waiting period to ensure proper distribution of the radiotracer, photos are taken with a gamma camera to capture images of the blood flow. Photos taken before and after exercise are examined to assess the state of the coronary arteries of the patient.
Showing the relative amounts of radioisotope within the heart muscle, the nuclear stress tests more accurately identify regional areas of reduced blood flow.
Stress and potential cardiac damage from exercise during the test is a problem in patients with ECG abnormalities at rest or in patients with severe motor disability. Pharmacological stimulation from vasodilators such as dipyridamole or adenosine, or positive chronotropic agents such as dobutamine can be used. Testing personnel can include a cardiac radiologist, a nuclear medicine physician,a nuclear medicine technologist, a cardiology technologist, a cardiologist, and/or a nurse.
References
-
Gibbons, R., Balady, G.; Timothybricker, J., Chaitman, B., Fletcher, G., Froelicher, V., Mark, D., McCallister, B. et al. (2002). ACC / AHA 2002 guideline update for exercise testing: summary article A report of the American College of Cardiology / American Heart Association Task Force on Practice Guidelines, Journal of the American College of Cardiology
-
American College of Cardiology, Five Things Physicians and Patients Should Question, Choosing Wisely: an initiative of the ABIM Foundation (American College of Cardiology), retrieved August 17 2012
-
Taylor, A. J.; Cerqueira, M.; Hodgson, J. M. .; Mark, D.; Min, J.; O'Gara, P.; Rubin, G. D.; American College of Cardiology Foundation Appropriate Use Criteria Task Force et al. (2010). ACCF/SCCT/ACR/AHA/ASE/ASNC/NASCI/SCAI/SCMR 2010 Appropriate Use Criteria for Cardiac Computed Tomography. Journal of the American College of Cardiology 56 (22): 1864–1894. doi:10.1016/j.jacc.2010.07.005. PMID 21087721. edit
-
Douglas, P. S.; Garcia, M. J.; Haines, D. E.; Lai, W. W.; Manning, W. J.; Patel, A. R.; Picard, M. H.; Polk, D. M. et al. (2011). ACCF/ASE/AHA/ASNC/HFSA/HRS/SCAI/SCCM/SCCT/SCMR 2011 Appropriate Use Criteria for Echocardiography. Journal of the American College of Cardiology 57 (9): 1126–1166. doi:10.1016/j.jacc.2010.11.002. PMID 21349406. edit
-
Hendel, R. C.; Abbott, B. G.; Bateman, T. M.; Blankstein, R.; Calnon, D. A.; Leppo, J. A.; Maddahi, J.; Schumaecker, M. M. et al. (2010). The role of radionuclide myocardial perfusion imaging for asymptomatic individuals. Journal of Nuclear Cardiology 18 (1): 3–15. doi:10.1007/s12350-010-9320-5. PMID 21181519. edit
-
Henzlova, Milena; Cerqueira, Hansen, Taillefer, Yao (2009). Stress Protocols and Tracers. Journal of Nuclear Cardiology. doi:10.1007/s12350-009-9062-4.
-
Rimmerman, Curtis (2009-05-05). The Cleveland Clinic Guide to Heart Attacks. Kaplan Publishing. pp. 113–. ISBN 978-1-4277-9968-5. Retrieved 25 September 2011.
-
Weissman, Neil J.; Adelmann, Gabriel A. (2004). Cardiac imaging secrets. Elsevier Health Sciences. pp. 126–. ISBN 978-1-56053-515-7. Retrieved 25 September 2011.
-
Nicholls, Stephen J.; Worthley, Stephen (2011-01). Cardiovascular Imaging for Clinical Practice. Jones & Bartlett Learning. pp. 198–. ISBN 978-0-7637-5622-2. Retrieved 25 September 2011.

